◀ ▲ ▶Branches / Knot-theory / Definition: Knot Diagram, Classical Crossing, Virtual Crossing
Definition: Knot Diagram, Classical Crossing, Virtual Crossing
According to Peter Guthrie Tait (1831 - 1901), a knot diagram is a projection of a closed curve in three-dimensional space \(\mathbb R^3\) onto a plane. For instance, projecting the following curve onto a plane
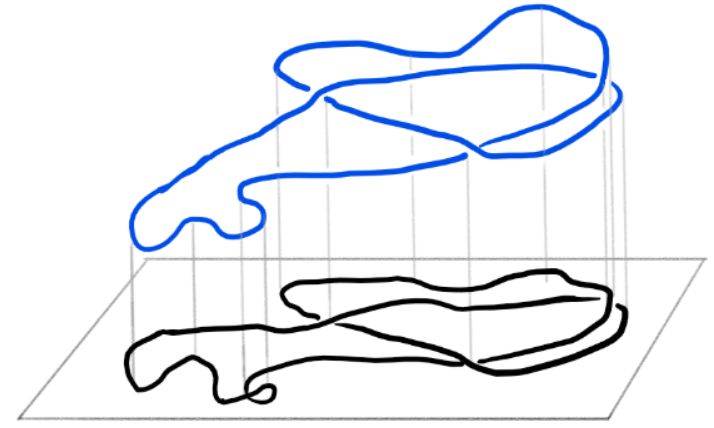
(image source: bookofproofs)
could result in the following knot diagram:
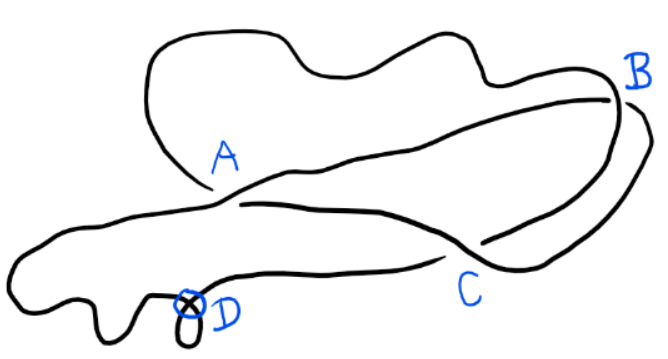
(image source: bookofproofs)
Every knot diagram fulfills the following three properties:
- The projected curve is smooth, i.e. there are no cusps and every point has a tangent line.
- Points of intersection are formed by at most two segments of the curve. These points are called double points. In the above example, the points \(A, B, C\) and \(D\) are double points.
- Every double point has exactly two different tangent lines (this eliminates the possibility of a double point with only one tangent line, where the curve does not actually cross itself but where two line segments still touch each other at a point).
- Each curve can be approximated by a finite number of line segments.
There are two types of double points:
- A classical crossing is a double point in a plane marked with under/overpassing information of the underlying three dimensional curve. In the above example, the double points \(A,B\) and \(C\) are classical crossings.
- A virtual crossing is a double point in a plane, which has no corresponding under/overpassing three dimensional curve. Rather, the idea is that the virtual crossing is not really there. In the above example, the point \(D\) is a virtual crossing. By convention, a virtual crossing is denoted by a small circle around it.
Mentioned in:
Definitions: 1 2
Proofs: 3
Propositions: 4
Thank you to the contributors under CC BY-SA 4.0! 

- Github:
-

References
Bibliography
- Dye, Heather: "An Invitation to Knot Theory", CRC Press, 2016
- Kauffman, L.: Virtual Knot Theory